
Day to Day Temperature Difference
Surface data from NCDC’s Global Summary of Days data, this is ~72 million daily readings,
from all of the stations with >360 daily samples per year.
Data source:
ftp://ftp.ncdc.noaa.gov/pub/data/gsod/
Code and reports (chart source data):
http://sourceforge.net/projects/gsod-rpts/

y = -0.0001x + 0.001
R² = 0.0572
This is a chart of the annual average of day to day surface station change in min temp.
(Tmin day-1)-(Tmin d-0)=Daily Min Temp Anomaly= MnDiff = Difference
For charts with MxDiff it is equal = (Tmax day-1)-(Tmax d-0)=Daily Max Temp Anomaly= MxDiff
MnDiff is also the same as
(Tmax day-1) – (Tmin day-1) = Rising
(Tmax day-1) – (Tmin day-0) = Falling
Rising-Falling = MnDiff

Average daily rising temps
(Tmax day-1) – (Tmin day-1) = Rising

Normalized Day to day difference with Daily Solar Forcing(WattHrs) and Rising temps

Yearly Average Min and Max Diff w/trend line Plus Surface Station count.

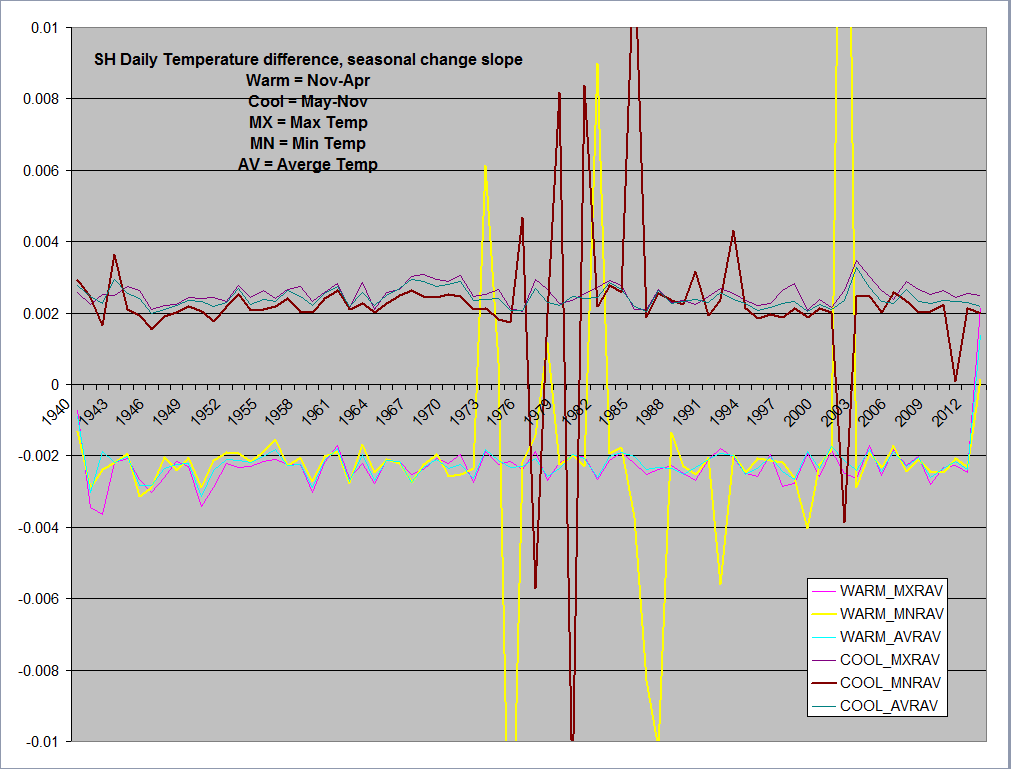
Day to Day Seasonal Slope Change
Throughout the year, especially in the extratropics, the length of time the Sunshines overhead changes.
Many have wished for some way to turn the Sun off for a while to see what surface temps do, well this happens daily.
You can see the balance of energy in the Earth system as the day becomes shorter, as well as see the length of day increase.
The surface temp responds to this with a change in temp, you can plot the rate of change for each station and look to see
if Co2 has altered the slope over the years.
If you plot daily MnDiff daily for a year, it’s a sine wave.

You can take the slope of the months leading up to and past the zero crossing,
both for summer (cooling) and winter (warming)
and plot thoses.
Global

Southern Hemisphere
is flat, other than some large disturbances in the 70’s and 80’s, and then again 2003.
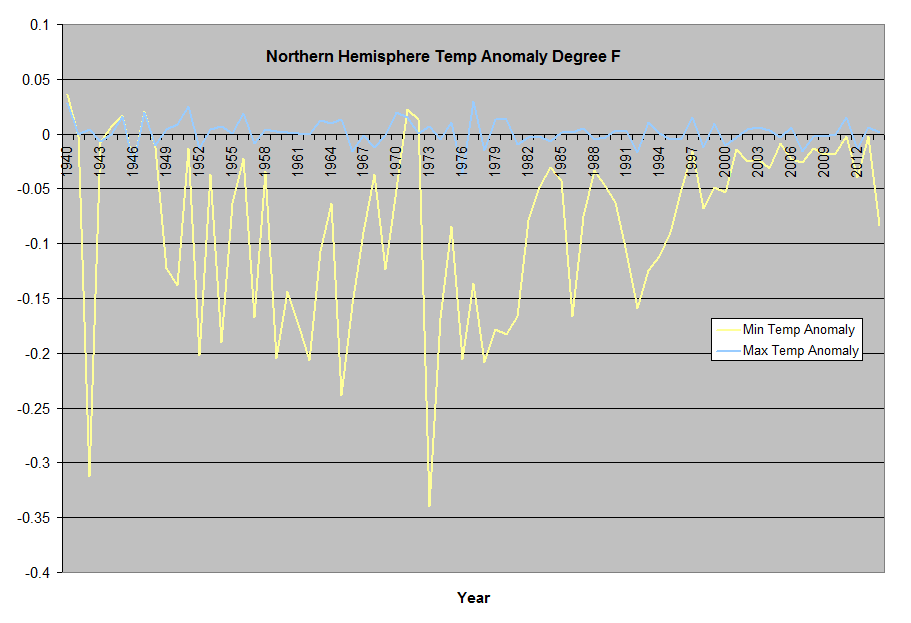
Northern Hemisphere has a slight curve. A disturbance in 1973 when surface stations were changed,
And 1988

There are a number of regions with few stations, making some areas susceptible to large fluxuations,
or it could be a real disturbance in temps, they are timely to the transistions in the
Ocean cycles and the warm cycle and the start of the cooling cycle.
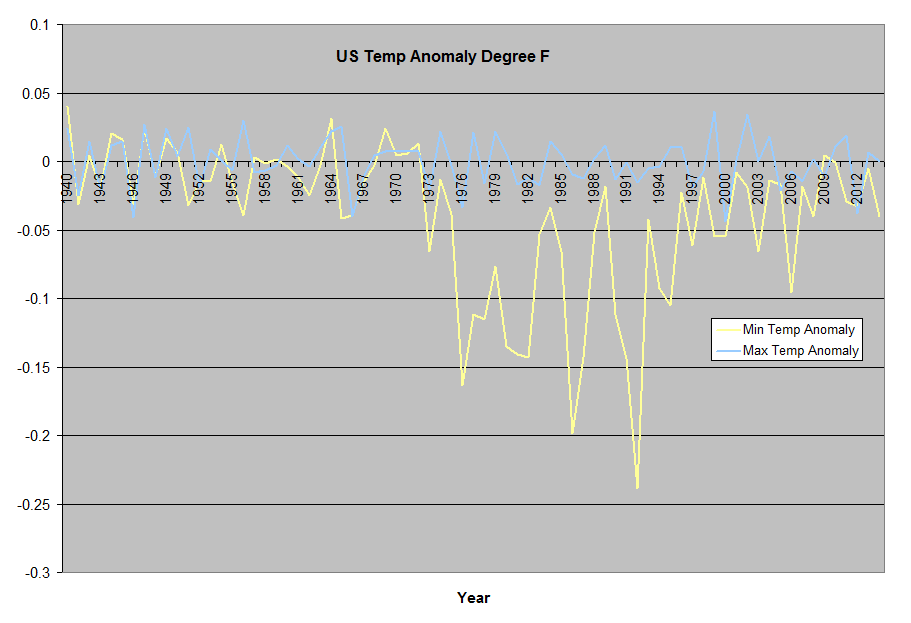
US Seasonal Slope
The US has the best surface station coverage in the world.

Eurasia Seasonal Slope

Northern Hemisphere w/trend line

Southern Hemisphere w/trend line

IR
Here is a sample of IR readings from a clear sky day, starting at 6:30pm, 11:00pm, 12:00pm, then 6:30am.
![]()
You can see how cold the sky is in 8u-14u, and how the surface warms and cools.
The ground cools until Sunrise.And the Grass acts as if it’s insulation,
ie trapped air allows the top surface to warm and cool quickly.
Yes this doesn’t show the impact of Co2, but you can add it back in, but even at that there is a big window open to space that is cold.
Regional Graphs
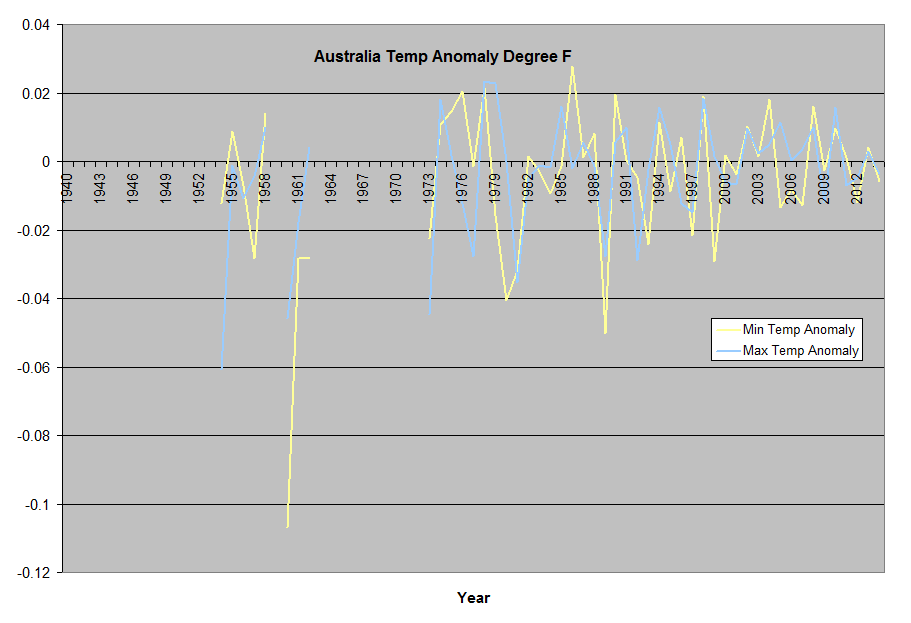
Regional annual averaged daily differences.
(Tmin day-1)-(Tmin d-0)=Daily Min Temp Anomaly= MnDiff
(Tmax day-1)-(Tmax d-0)=Daily Max Temp Anomaly= MxDiff
Global Average

US +24.950 to +49.410 Lat: -67 to -124.8 Lon
Tropics -23.433 to +23.433 Lat

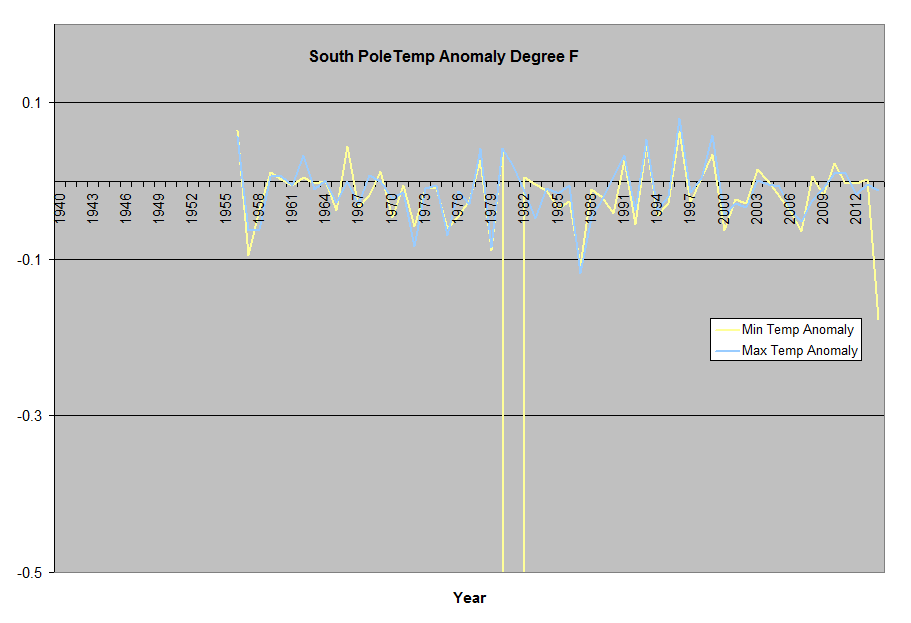
Southpole -66.562 to -90 Lat
Southern Hemisphere -23.433 to -66.562 Lat

South America -23.433 to -66.562 Lat: -30 to +180 Lon

Northpole +66.562 to +90 Lat

Northern Hemisphere +23.433 to +66.562 Lat
Eurasia +24.950 to +49.410 Lat: -08 to +180 Lon

Australia -23.433 to -66.562 Lat: -100 to -180 Lon
Africa -23.433 to -66.562 Lat: -100 to -30 Lon

Max Rel Humidity limiting surface cooling.

The next night I measured the IR temperature of the sky during the night, and if anything it gets cooler through the night, while cooling slows with humidity.
![]()
At night, days of high humidity, as it cools off, Rel humidity
reaches near 100% at which point water starts to condenses out.
Over longer periods you can see how humidity cycles on a daily basis.

You can see this effect at my location (N41,W81) Depending on the path of the jet stream we either get tropical air from the gulf, or polar air from Canada.

This is good for a 10-20F swing in temps, and it is my opinion the oceans act as pins for the jet stream, which then effects the flow over the continents,
and these changes show up in the temperature record.
Regional annual averaged daily differences.
(Tmin day-1)-(Tmin d-0)=Daily Min Temp Anomaly= MnDiff
(Tmax day-1)-(Tmax d-0)=Daily Max Temp Anomaly= MxDiff
Southpole -66.562 to -90 Lat
Northpole +66.562 to +90 Lat
This is a chart of the annual average of day to day surface station change in min temp for N37-49,W104-120 the US Southwest deserts.
(Tmin day-1)-(Tmin d-0)=Daily Min Temp Anomaly= MnDiff = Difference
For charts with MxDiff it is equal = (Tmax day-1)-(Tmax d-0)=Daily Max Temp Anomaly= MxDiff
MnDiff is also the same as
(Tmax day-1) – (Tmin day-1) = Rising
(Tmax day-1) – (Tmin day-0) = Falling
Rising-Falling = MnDiff

Average daily rising temps
(Tmax day-1) – (Tmin day-1) = Rising
(Tmax day-1) – (Tmin day-0) = Falling

What I’ve done with surface station data, a modest weather station, and an IR thermometer the last 5-6 years.

MICRO, what part of Ohio are you from? I’m from Ohio as well. Maybe we can team up on some efforts.
LikeLike
Northeast, near Hudson. How about you?
LikeLike