Observational evidence for a nonlinear night time cooling mechanism

An analysis of nightly cooling has identified non-linearity in cooling rates under clear sky no wind conditions that is not due to equilibrium with the with the radiative temperature of the sky. This non-linearity regulates surface temperature cooling at night, and is temperature and dew point dependent, not co2, and in fact any additional warming from Co2 has to be lost to space, before the change to the slower cooling rate.

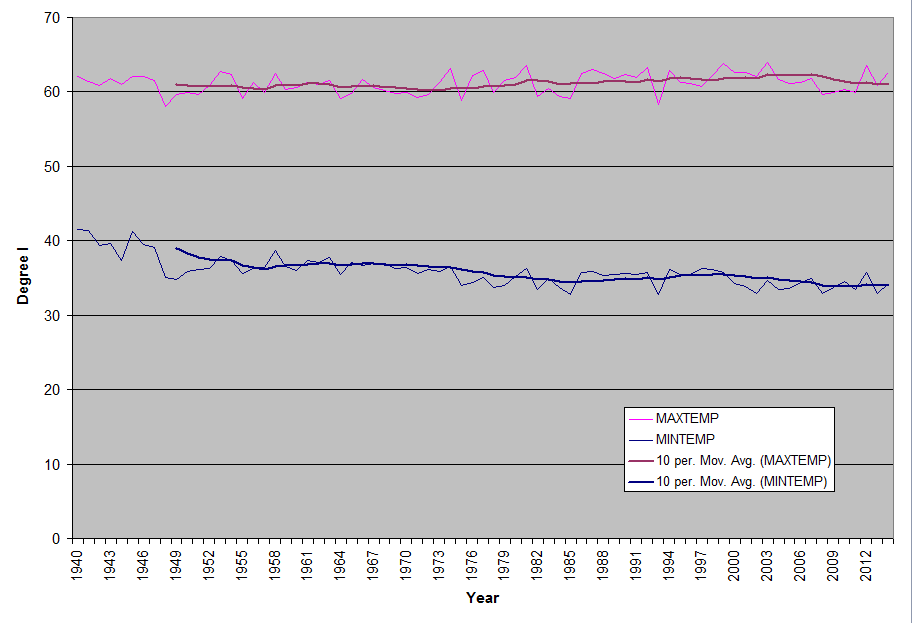
Nightly data with min temps following dew point temp.

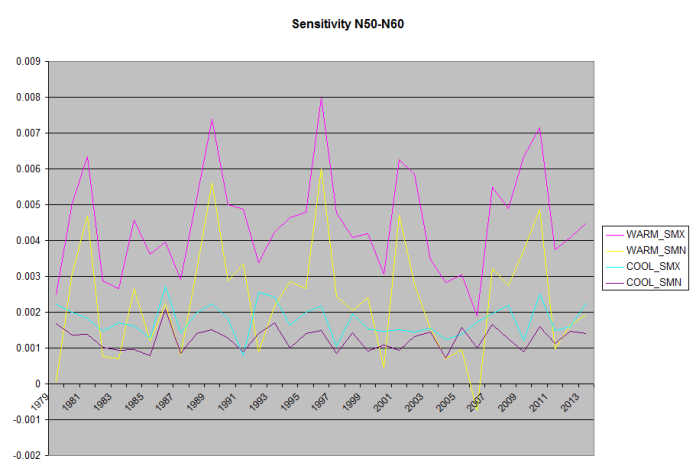
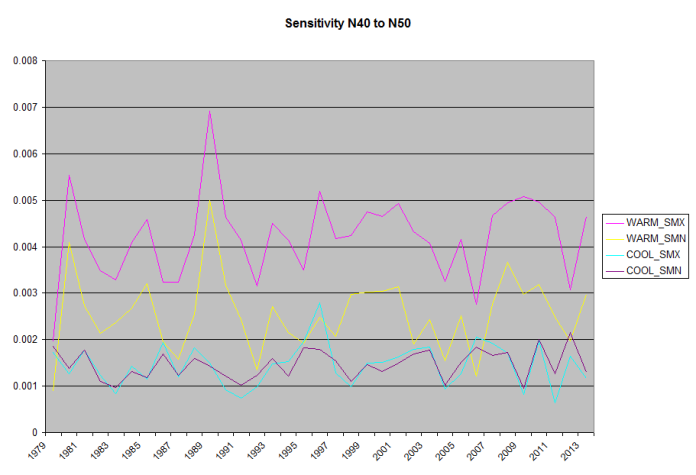
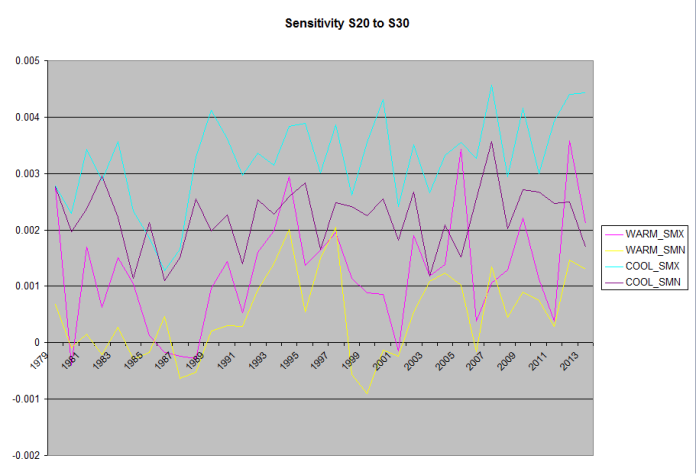
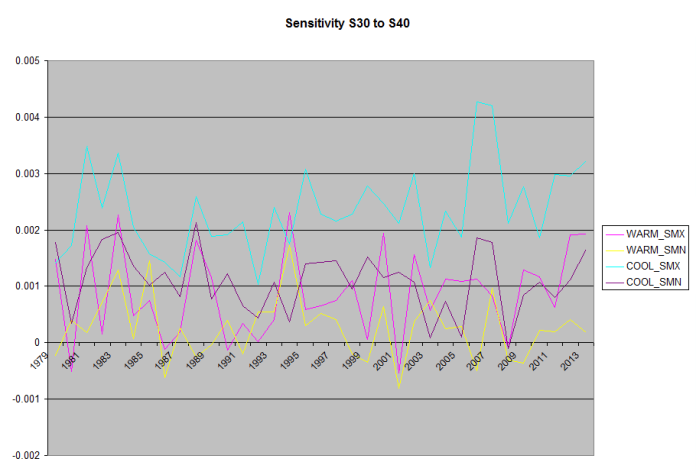
Just under 60 million surface station measurements from around the world showing min temp following dew point.

Night time cooling is nonlinear, at sunset the cooling rate is very high, this is the regime controlled by co2, but later in the night, as air Temps near dew point, cooling greatly slows, this is the regime controlled by water vapor. The thing is, even if there is a slight warming from co2, that heat is lost to space prior to the switch to the low cooling rate water vapor controlled regime(because the switch is temp controlled). Water vapor controls cooling, not co2. Consider deserts and tropics as the 2 extreme examples, deserts, mostly co2 limited cooling drop on average of 35F in a night, there tropics controlled by water drop on average 15F at night. Lastly the only way co2 can affect Temps is to reduce night time cooling, it doesn’t.

I finally found another Scientist looking at cooling, and they found that cooling was exponential. After exchanging messages, he send me the link to the data they collected, and in it had weather and solar, I looked at a few sample clusters of days, and found what I was looking for.

1997-daily-cooling-sample-with-inset

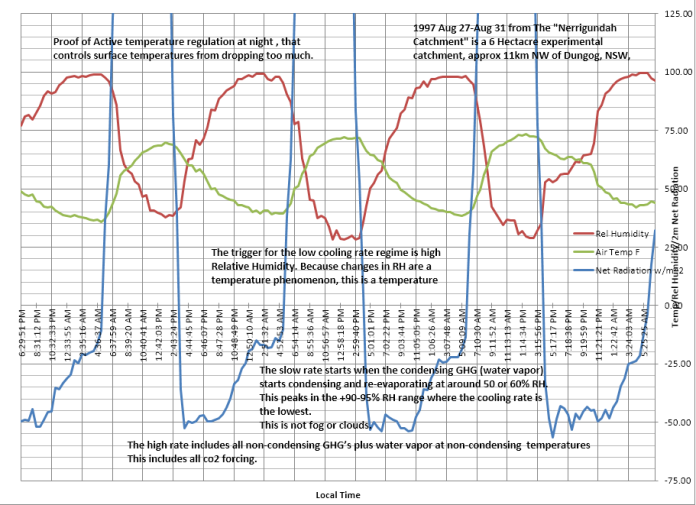
This is part of 6 days. But the key data is the NetRad, note how during the night at the same time rel humidity nears 100%, net radiation drops by 2/3rds. This data covers at least 2 clear days, and the other days are mostly clear. There are many examples of this.

This is the evidence that supports my theory that water vapor regulated nightly cooling, and co2 doesn’t do anything.

Increasing relative humidity is the temperature regulation of nightly cooling, not co2.

Here is the same date, just a closer view.

1997 Daily With X Axis

The effects of a 2 state cooling rate(4F/hour, 1F/hour), both starting at 75/77F One with a 60F dew point, the other a 50F dew point.

Both examples converge to the same final temp.
If we could see this invisible process I think we’d see something like this

I added a link to Dr Gray’s paper, which is really a description of the same effect.
2. Variations of Radiation is only a part of the Climate Change Physics
Internal mechanisms of the global energy budget such as evaporation-condensation and deep global ocean current variations also play an independent role from radiation as a major climate change mechanism (Figure 3). The whole AGW theory and dialog over the years has been based on radiation changes. This is far too narrow and naïve.
Later on he points out observed negative feedback of -0.2C(pg16), not positive, I believe it will be closer to net 0C than +0.3C/doubling. But in either case it is non-catastrophic, and probably beneficial, and the complete burning of all fossil fuels isn’t projected to case the atm levels of co2 to be more than about 800ppm. I to believe that it’s the oceans moving warm pools of water around, and the impact of that water vapor as it’s redistributed over land downwind. Just as an el nino, a redistribution of stored warm water, causes a global rise in average temp. the ocean cycles do the same thing, just over a longer period of time.
Data source:
ftp://ftp.ncdc.noaa.gov/pub/data/gsod/
Code and reports (chart source data):
http://sourceforge.net/projects/gsod-rpts/
Reference:
M. Pattantyús-Ábrahám and I. M. Jánosi
Department of Physics of Complex Systems, University, Budapest, Hungary
William M Gray
Professor Emeritus Department of Atmospheric Science Colorado State University
Standard

Measuring Surface Climate Sensitivity

By calculating the daily rate of change in the extra-tropics as the length of day changes throughout the year, it is possible to use this data when added to the clear sky daily solar input for that location to generate an actual measured climate sensitivity.

Data source:
ftp://ftp.ncdc.noaa.gov/pub/data/gsod/
Code and reports (chart source data):
http://sourceforge.net/projects/gsod-rpts/

I started with the day to day change in both min (mndiff) and max (mxdiff) temps for each day of the year.

This is the derivative of temperature by day, the maximum peaks in March in the northern hemisphere, the negative peak happening in October, the slope between peaks is calculated with the PL/SQL Slope function between March and October as Cooling, and from October to March as Warming.

1950-2010 D100_0

This is an over lay of the day to day change in temp for all stations in the US 1950-2010.

Taking the slope of the change in temperature as the length of day is changing and then dividing that by the slope of daily solar input in Whr/m^2/day (Work/Day/Watt), gives us an actual Climate Sensitivity. This is the response in Temp F°/Whr/m^2/day (divide by 43.2 to get the instantaneous rate in C° ) at that station. A collection of stations based on area are then averaged together.

Because the daily Solar input is strongly dependent on Latitude, I’ve calculated and graphed this for 10 degrees latitude bands starting @N/S 20 going to N/S 90, no stations north of N80 meet the inclusion requirements (360 days per year collecting samples by station).

LatBand_N60-70_Sensitivity

Temp F°/Whr/m^2/day

LatBand_N50-60_Sensitivity

Temp F°/Whr/m^2/day

LatBand_N40-50_Sensitivity

Temp F°/Whr/m^2/day

LatBand_N30-40_Sensitivity

Temp F°/Whr/m^2/day

LatBand_N20-30_Sensitivity

Temp F°/Whr/m^2/day

Note, because the Southern Hemisphere’s seasons are reversed, the Warming/Cooling labels are backwards.

LatBand_S20-30_Sensitivity

Temp F°/Whr/m^2/day

LatBand_S30-40_Sensitivity

Temp F°/Whr/m^2/day

LatBand_S40-50_Sensitivity

Temp F°/Whr/m^2/day

LatBand_S50-60_Sensitivity

Temp F°/Whr/m^2/day

LatBand_S60-70_Sensitivity

Temp F°/Whr/m^2/day

Standard

Evidence against warming from Carbon Dioxide

Day to Day Temperature Difference
Surface data from NCDC’s Global Summary of Days data, this is ~72 million daily readings,
from all of the stations with >360 daily samples per year.
Data source:
ftp://ftp.ncdc.noaa.gov/pub/data/gsod/
Code and reports (chart source data):
http://sourceforge.net/projects/gsod-rpts/


y = -0.0001x + 0.001
R² = 0.0572
This is a chart of the annual average of day to day surface station change in min temp.
(Tmin day-1)-(Tmin d-0)=Daily Min Temp Anomaly= MnDiff = Difference
For charts with MxDiff it is equal = (Tmax day-1)-(Tmax d-0)=Daily Max Temp Anomaly= MxDiff
MnDiff is also the same as
(Tmax day-1) – (Tmin day-1) = Rising
(Tmax day-1) – (Tmin day-0) = Falling
Rising-Falling = MnDiff

Average daily rising temps
(Tmax day-1) – (Tmin day-1) = Rising

Normalized Day to day difference with Daily Solar Forcing(WattHrs) and Rising temps

Yearly Average Min and Max Diff w/trend line Plus Surface Station count.

Day to Day Seasonal Slope Change

Throughout the year, especially in the extratropics, the length of time the Sunshines overhead changes.
Many have wished for some way to turn the Sun off for a while to see what surface temps do, well this happens daily.
You can see the balance of energy in the Earth system as the day becomes shorter, as well as see the length of day increase.
The surface temp responds to this with a change in temp, you can plot the rate of change for each station and look to see
if Co2 has altered the slope over the years.
If you plot daily MnDiff daily for a year, it’s a sine wave.

You can take the slope of the months leading up to and past the zero crossing,
both for summer (cooling) and winter (warming)
and plot thoses.
Global

Southern Hemisphere
is flat, other than some large disturbances in the 70’s and 80’s, and then again 2003.

Northern Hemisphere has a slight curve. A disturbance in 1973 when surface stations were changed,
And 1988

There are a number of regions with few stations, making some areas susceptible to large fluxuations,
or it could be a real disturbance in temps, they are timely to the transistions in the
Ocean cycles and the warm cycle and the start of the cooling cycle.

US Seasonal Slope
The US has the best surface station coverage in the world.

Eurasia Seasonal Slope

Northern Hemisphere w/trend line

Southern Hemisphere w/trend line

IR

Here is a sample of IR readings from a clear sky day, starting at 6:30pm, 11:00pm, 12:00pm, then 6:30am.

You can see how cold the sky is in 8u-14u, and how the surface warms and cools.
The ground cools until Sunrise.And the Grass acts as if it’s insulation,
ie trapped air allows the top surface to warm and cool quickly.
Yes this doesn’t show the impact of Co2, but you can add it back in, but even at that there is a big window open to space that is cold.

Regional Graphs

Regional annual averaged daily differences.
(Tmin day-1)-(Tmin d-0)=Daily Min Temp Anomaly= MnDiff
(Tmax day-1)-(Tmax d-0)=Daily Max Temp Anomaly= MxDiff
Global Average

US  +24.950 to +49.410 Lat: -67 to -124.8 Lon

Tropics -23.433 to +23.433 Lat

Southpole -66.562 to -90 Lat

Southern Hemisphere -23.433 to -66.562 Lat

South America -23.433 to -66.562 Lat: -30 to +180 Lon

Northpole +66.562 to +90 Lat

Northern Hemisphere +23.433 to +66.562 Lat

Eurasia +24.950 to +49.410 Lat: -08 to +180 Lon

Australia -23.433 to -66.562 Lat: -100 to -180 Lon

Africa -23.433 to -66.562 Lat: -100 to -30 Lon

Max Rel Humidity limiting surface cooling.

The next night I measured the IR temperature of the sky during the night, and if anything it gets cooler through the night, while cooling slows with humidity.


At night, days of high humidity, as it cools off, Rel humidity
reaches near 100% at which point water starts to condenses out.

Over longer periods you can see how humidity cycles on a daily basis.

You can see this effect at my location (N41,W81) Depending on the path of the jet stream we either get tropical air from the gulf, or polar air from Canada.

This is good for a 10-20F swing in temps, and it is my opinion the oceans act as pins for the jet stream, which then effects the flow over the continents,
and these changes show up in the temperature record.

Regional annual averaged daily differences.
(Tmin day-1)-(Tmin d-0)=Daily Min Temp Anomaly= MnDiff
(Tmax day-1)-(Tmax d-0)=Daily Max Temp Anomaly= MxDiff

Southpole -66.562 to -90 Lat
Northpole +66.562 to +90 Lat

This is a chart of the annual average of day to day surface station change in min temp for N37-49,W104-120 the US Southwest deserts.
(Tmin day-1)-(Tmin d-0)=Daily Min Temp Anomaly= MnDiff = Difference
For charts with MxDiff it is equal = (Tmax day-1)-(Tmax d-0)=Daily Max Temp Anomaly= MxDiff
MnDiff is also the same as
(Tmax day-1) – (Tmin day-1) = Rising
(Tmax day-1) – (Tmin day-0) = Falling
Rising-Falling = MnDiff

Average daily rising temps
(Tmax day-1) – (Tmin day-1) = Rising
(Tmax day-1) – (Tmin day-0) = Falling

What I’ve done with surface station data, a modest weather station, and an IR thermometer the last 5-6 years.


Standard